Want dashboards that are always up-to-date? Real-time data integration makes it possible. It connects multiple data sources instantly, ensuring your dashboards reflect the latest information. Here's what you'll learn:
- Why Real-Time Matters: Faster decisions, better visibility, and agility.
- Challenges: Managing data speed, quality, security, and scalability.
- Top Tools: Power BI, Tableau, Grafana, Looker, and Lucid Financials.
- How to Build: Define key metrics, integrate data sources, and design clear dashboards.
- Best Practices: Ensure data quality, optimize for performance, and secure your system.
Ready to create dashboards that deliver live insights? Let’s dive in.
Create a Power BI streaming dataset for real-time dashboards
Selecting Tools for Real-Time Dashboards
Overview of Dashboard Tools
There are several tools to consider when building real-time dashboards, each offering distinct strengths. For example, Tableau is ideal for creating detailed visualizations, while Power BI works seamlessly with Microsoft services and delivers AI-driven insights. Grafana is particularly useful for time-series monitoring, and Looker focuses on advanced data modeling capabilities [3].
| Tool | Key Features |
|---|---|
| Tableau | Advanced visualizations for data storytelling |
| Power BI | Integration with Microsoft services and AI insights |
| Grafana | Time-series monitoring and custom plugins |
| Looker | Scalable analytics and strong data modeling |
One tool worth noting is Lucid Financials, which is specifically designed for financial analytics and real-time insights.
Factors to Consider When Choosing Tools
When selecting a dashboard tool, keep these factors in mind:
- Data Source Compatibility: Ensure the tool supports your existing data sources and can handle live updates [3].
- Performance: Assess whether the tool can manage your data volume efficiently with advanced processing capabilities [2].
- Key Features: Look for built-in security, scalability, and compliance options that match your industry requirements [3][4].
Using Lucid Financials for Real-Time Insights

Lucid Financials streamlines financial benchmarking by integrating seamlessly with various data sources. It offers flexible pricing plans and advanced tools like scenario planning and live financial insights.
For startups and SMBs, it provides instant financial planning and industry benchmarking to stay competitive. Its AI-driven analytics quickly detect trends and anomalies, allowing businesses to respond to market shifts more effectively than traditional methods.
Once you've chosen the right dashboard tools, the next step is to define your metrics and connect your data sources.
Steps to Build Real-Time Dashboards
Choosing Key Metrics and KPIs
Start by identifying metrics that align with your business goals. Focus on indicators that are specific, measurable, and time-sensitive. Here's an example breakdown of key metrics:
| Metric Category | Key Indicators |
|---|---|
| Financial Health | Revenue, Cash Flow, Profit Margins |
| Customer Success | Acquisition Cost, Lifetime Value, Churn Rate |
| Operational | Processing Time, Error Rates, System Uptime |
| Market Position | Market Share, Competitive Pricing, Growth Rate |
Make sure to define metrics in a way that provides actionable insights. For instance, track daily revenue per product category instead of using vague, high-level figures.
Integrating Data Sources
Once your metrics are set, the next step is connecting the data sources that will supply real-time updates to your dashboard. Here’s how you can approach it:
- Direct API Connections: Use APIs from platforms like Salesforce to pull data directly into your dashboard for real-time updates.
- Streaming Data Architecture: Leverage tools like Power BI’s streaming features to process and display data as it’s generated [6].
- Data Validation: Set up automated checks to ensure your data is accurate and reliable.
With your data sources linked, you can shift your focus to designing a dashboard that delivers clear and actionable insights.
Creating the Dashboard
When designing your dashboard, prioritize simplicity and clarity. Keep these principles in mind:
- Layout Structure: Place critical metrics at the top for easy access, and include drill-down options for more detailed analysis.
- Visual Clarity: Use the right chart types for your data. For example, line charts work well for showing trends over time.
- Performance Optimization: Rely on materialized views or pre-aggregated data to minimize query delays and keep your dashboard responsive.
Once your dashboard is live, maintaining its performance and ensuring data quality will be key to its long-term success.
sbb-itb-17e8ec9
Best Practices for Real-Time Data Dashboards
Ensuring Data Quality
Maintaining high-quality data is essential for accurate and reliable dashboards. A structured approach to monitoring and verifying data ensures everything runs smoothly. Here's how you can do it:
| Quality Control Level | Implementation Method | Purpose |
|---|---|---|
| Pipeline Monitoring | Automated quality checks | Maintain data integrity during processing |
| Output Verification | Regular data audits | Confirm the accuracy of final dashboard data |
| Performance Metrics | Real-time monitoring | Keep track of data quality indicators |
Improving Scalability and Performance
To keep your dashboards running efficiently, focus on strategies that enhance speed and handle large data volumes. Techniques like in-memory analytics, distributed databases, and cloud platforms such as Azure Stream Analytics [1] can make a big difference. Materialized views also help by pre-computing data to reduce response times [5].
Some effective optimization methods include:
- Using cloud-based processing for intensive workloads.
- Setting up caching systems for frequently accessed data.
- Adopting distributed computing for handling complex calculations.
While these strategies ensure your dashboard can scale with growing data demands, don’t overlook the importance of protecting sensitive information.
Security and Compliance
Strong security practices are non-negotiable when working with real-time data. Role-based permissions, encrypted data transfers, and regular security checks form the backbone of a secure dashboard environment. SQL databases with transaction-based processing help maintain both data consistency and query efficiency [2].
Key security measures include:
| Security Measure | Purpose |
|---|---|
| Role-based Access | Limit and control who sees what data |
| Encryption | Safeguard sensitive information |
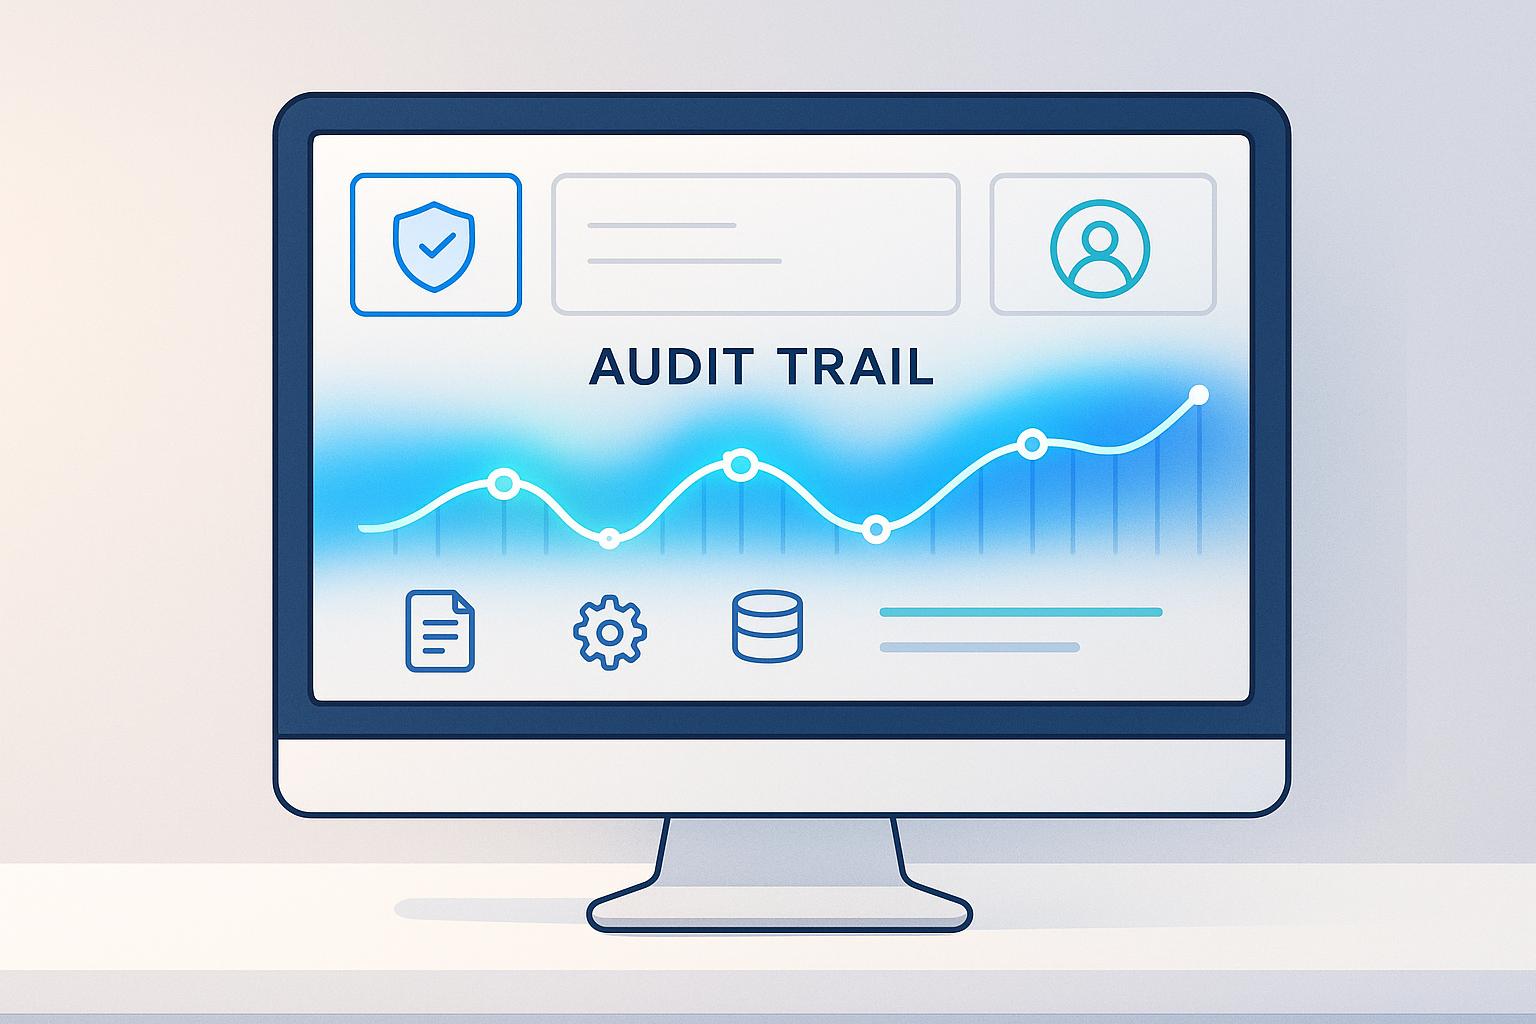
| Audit Logging | Monitor system access and changes |
Tools like Atlassian Analytics can further enhance security while ensuring quick and efficient data access [2].
Conclusion and Key Points
Summary of Steps
Creating effective real-time dashboards requires a clear plan and the right mix of technical skills and strategic thinking. From connecting data sources to deploying a fully functional dashboard, every step plays a crucial role.
| Phase | Key Components | Focus Area |
|---|---|---|
| Planning | Metrics Selection & Tool Choice | Identify KPIs and assess platform features |
| Integration | Data Source Connection & Processing | Build dependable data pipelines and validate inputs |
| Optimization | Performance & Security | Use caching and enforce access controls |
Real-time dashboards are making a big impact in fields like finance, where they allow for instant analysis and faster decision-making.
Insights on Lucid Financials
For businesses working to implement these dashboards, tools like Lucid Financials can simplify the process. The platform provides scalable solutions tailored to businesses of all sizes, offering real-time insights and financial planning tools. Its ability to integrate with a variety of financial systems makes it an excellent choice for organizations that need constant visibility into their financial health.
Success with real-time dashboards hinges on maintaining high data quality and ensuring the system performs well as it scales. The best dashboards prioritize quick access to data without sacrificing ease of use, while also safeguarding system integrity with strong security and performance measures.
FAQs
What is used to create a real-time dashboard?
Building a real-time dashboard involves combining several key components. Here's a breakdown:
| Component | Purpose | Examples |
|---|---|---|
| Data Source | Stores and manages raw data | MySQL, PostgreSQL, MongoDB, Salesforce |
| Integration Tool | Processes and connects the data | Apache Kafka, Zapier, MuleSoft |
| Visualization Tool | Transforms data into visuals | Tableau, Power BI, Metabase |
For those starting out, Metabase is a free, open-source tool that supports SQL queries and real-time dashboards. If you're looking for more advanced options, Tableau and Power BI offer powerful integration and visualization capabilities.
When creating a real-time dashboard, keep these factors in mind:
- Tools should directly integrate with your database.
- Real-time data processing is essential for up-to-date insights.
- Interactive visualizations improve user experience.
For real-time updates, you can opt for:
- Push technology: Provides instant updates but involves more complex systems.
- Pull technology: Refreshes data at scheduled intervals and is simpler to implement.
It's crucial to select tools that match your data sources and visualization goals while ensuring a balance between performance and data accuracy. This approach lays the groundwork for creating effective real-time dashboards.


