
A medical practice’s operating reserves have a job: make funds available when provider and administrative payroll, rent, vendor bills and capital commitments fall due. An AI-generated market forecast does not establish that those funds will be available in the required amount on the required date.
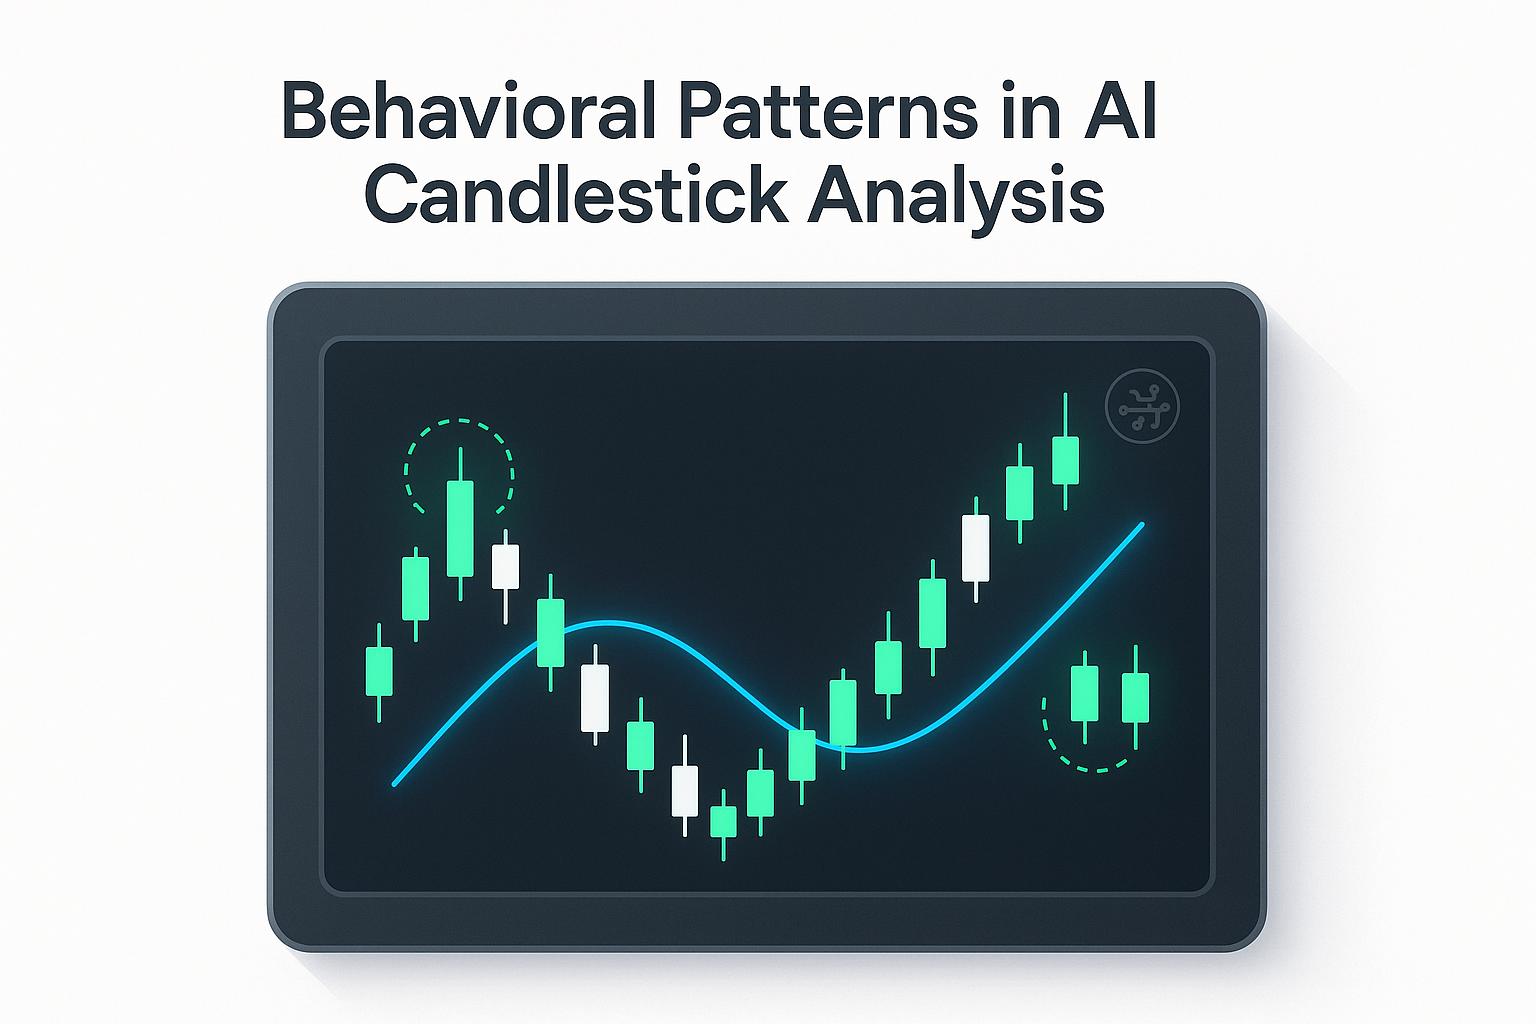
Candlestick charts summarize market prices. AI tools can classify their shapes and search historical data for recurring patterns. But recognizing a pattern is different from predicting a profitable outcome—and both are different from protecting a practice’s ability to pay its obligations.
For owners and managers of staffed US private practices, the useful question is not, “Can AI find a promising chart?” It is, “What market exposure, if any, is compatible with this money’s purpose and payment deadline?” This article explains the charts, their behavioral interpretations and a practical treasury review. It does not provide trading signals or securities recommendations.
What an Open-High-Low-Close Candlestick Shows
Each candle describes prices over a specified interval, such as a trading day. It contains four values:
| Component | Meaning | What it does not establish |
|---|---|---|
| Open | The first price recorded for the interval | A fair value or a suitable purchase price |
| High | The highest price recorded during the interval | A price available for the entire position whenever needed |
| Low | The lowest price recorded during the interval | A floor below which future prices cannot fall |
| Close | The final price recorded for the interval | The price the practice will receive on a later sale |
The candle’s body spans the open and close. Its wicks, or shadows, extend to the high and low. Colors commonly distinguish a close above the open from a close below it, but display conventions vary.
A long body describes a substantial open-to-close change relative to the chart’s scale. A small body with long wicks describes a wide range with a relatively small open-to-close change. Neither shape reveals every transaction or the order in which the high and low occurred.
The interval matters, too. A daily candle compresses intraday movements; a weekly candle compresses multiple trading days. Reviewing several timeframes adds context, but it does not turn a price summary into an assurance about future liquidity.
What AI Adds—and Why Behavioral Claims Need Caution
An AI system may analyze chart images, numerical price sequences or both. Depending on its design, it may label familiar shapes, compare historical windows or estimate an outcome defined by its developer.
These are separate tasks. Correctly labeling a candle does not establish that the next price movement is predictable. Predicting direction does not establish a positive return after costs. Neither establishes that proceeds will cover payroll on time.
Price patterns do not reveal investor motives
Candlestick commentary often describes “buyer conviction,” “seller exhaustion” or “market indecision.” Those phrases are interpretations, not direct observations of participants’ intentions.
The same shape can arise from different circumstances: news, changing liquidity, large transactions or ordinary variation. Even if an AI tool adds volume or other indicators, its explanation remains an inference. A fluent narrative about investor psychology is not proof of why prices moved or what happens next.
For a practice owner, this distinction matters when an interface turns a pattern label into a confident story. “The chart shows a small body and a long lower wick” is an observable description. “Investors have rejected lower prices, so reserves are safe here” is not a justified treasury conclusion.
Automation does not eliminate behavioral bias
AI can apply a classification rule consistently while still reflecting biased data, model choices or evaluation methods. Owners can also introduce bias when interpreting the output:
- Recency bias: A recent run of favorable results makes future success feel more likely than the evidence warrants.
- Confirmation bias: The owner notices signals supporting a desired investment and discounts conflicting information.
- Automation bias: A model’s confidence score receives more weight than the practice’s actual payment calendar.
- Loss aversion: After a decline, the owner delays raising needed cash because selling would recognize the loss.
Written treasury rules should therefore precede chart review. A market narrative should not redefine money already committed to staff or a facility project.
A Sample Chart-Reading Exercise
Illustrative example only: An unnamed market-traded asset has the following daily prices. These invented values are for reading a chart, not evaluating an investment.
| Day | Open | High | Low | Close |
|---|---|---|---|---|
| A | $100 | $103 | $98 | $102 |
| B | $102 | $104 | $95 | $96 |
| C | $96 | $99 | $92 | $97 |
On Day A, the close exceeds the open, so the body runs from $100 to $102. The full range is $98 to $103.
On Day B, the close is below the open. On Day C, the open-to-close change is small compared with the full price range, and the lower wick extends farther than the upper wick. A charting tool might assign Day C a named pattern or a directional interpretation.
Now separate three questions:
- What happened? Prices reached $92 and finished Day C at $97. The close was above that day’s open but below Day A’s close.
- What is unknown? The table does not show transaction volume, the sequence of the high and low, execution costs or the next available sale price.
- What does treasury need to know? Whether sufficient net proceeds can reach the correct practice account before its payment deadline, including under an adverse outcome.
Separate illustrative treasury scenario: A practice places $100,000 into a market-exposed position. It later needs $95,000 for payroll and vendor commitments. If the position’s realizable value falls to $90,000, the funding shortfall is $5,000 before transaction costs. A favorable-looking candle does not close that gap. Waiting for a recovery could miss the payment deadline.
The exercise is not about predicting the next candle. It is about recognizing that a price observation and a funding requirement answer different questions.
Why a Successful Backtest Does Not Prove Reserve Availability
A backtest applies a strategy to historical data. It can help investigate a claim, but its results depend on the data, assumptions and rules used.
Common weaknesses include:
- Overfitting: Rules are tuned to historical noise rather than a relationship that persists.
- Look-ahead bias or data leakage: The test inadvertently uses information unavailable at the simulated decision time.
- Selection bias: Failed assets, unfavorable periods or unsuccessful model versions are excluded.
- Unrealistic execution: Results assume prices, transaction costs or trading capacity unavailable in practice.
- Changing conditions: Relationships observed in one period do not persist in another.
A reported win rate also omits essential information. Frequent small gains can coexist with occasional large losses. A positive average return can coexist with a deep drawdown exactly when the practice needs cash. A drawdown is a decline from a prior peak; an eventual recovery does not repair a missed payroll deadline.
Independent testing on previously unseen data is more informative than repeatedly tuning a model against the same history. Even so, historical performance cannot establish future reserve availability. A practice needs a cash-availability assessment, not merely a prediction score.
sbb-itb-17e8ec9
Start Treasury Decisions With Payment Dates
Before evaluating any market-analysis tool, prepare a dated cash schedule. Use expected payer receipts and patient collections alongside actual disbursement commitments. Distinguish cash already collected from receivables that may arrive later than expected.
A profitable monthly P&L does not mean the practice has enough cash for the next payroll. Likewise, a consolidated balance can obscure a shortage in the entity that must make the payment.
| Cash purpose | Information to document | Treasury decision it informs |
|---|---|---|
| Provider and administrative payroll | Funding deadline, expected amount and paying entity | Funds that must be available before payroll processing |
| Rent and recurring vendors | Due dates, payment timing and flexibility | Near-term operating liquidity needs |
| Equipment or build-out commitments | Deposit dates, milestones and cancellation terms | Cash reserved for committed capital spending |
| Collections-delay contingency | Assumptions about delayed payer and patient receipts | Additional liquidity needed under a downside scenario |
| Potential longer-term surplus | Amount remaining after commitments and contingencies | Whether separate investment-policy advice is appropriate |
For multi-location or multi-entity practices, identify which entity owns each account, which entity owes each obligation and how shared costs are allocated. Do not assume every consolidated dollar is immediately transferable. Confirm any transfer restrictions and accounting implications with the appropriate advisers.
The IRS’s Publication 583 guidance on business records supports separate business accounts and bank reconciliation. Those practices help establish a reliable cash starting point; they do not validate a market strategy.
Medical Practice Treasury Decision Checklist
Use this checklist before allowing an AI-generated chart interpretation to influence a treasury decision.
1. Define the liquidity dates
- What amount must be available, in which entity’s account, and by what date?
- Does the deadline include time for liquidation, settlement, transfer and payroll processing?
- Which receipts are estimates rather than collected funds?
- What happens if a major payer’s receipts arrive later than expected?
The relevant date is when usable cash must reach the paying account—not simply when an asset could be sold.
2. Measure drawdown exposure against obligations
Estimate the cash available under adverse price scenarios, including costs and access constraints. Compare that amount with committed payments and the practice’s contingency requirement.
Express the result in operating terms: which obligations become unfunded? If the plan requires a price recovery before a fixed deadline, it depends on market timing. A model’s confidence score does not remove that dependence.
3. Check concentration and overlapping risks
Review concentration by issuer, asset type, financial institution and underlying economic exposure. Several positions may still respond similarly to the same market event.
Also examine the connection between business and investment risks. Could weaker collections coincide with a fall in reserve values? Would the owner’s personal investments or other businesses face the same pressure? Multiple account names do not necessarily mean independent sources of liquidity.
4. Confirm access and decision authority
Document who can authorize transactions and transfers, who provides backup coverage and which account receives proceeds. Ask about applicable withdrawal restrictions, redemption terms, settlement timing and fees.
Keep practice treasury decisions separate from an owner’s personal trading activity. Define who may approve exceptions and what happens if available liquidity falls below the practice’s established requirement.
5. Prepare questions for a licensed investment adviser
Ask an appropriately licensed investment adviser:
- How does the proposed approach match each cash need and its deadline?
- What losses or access restrictions could occur before those dates?
- How would the plan perform if collections slowed while market values declined?
- What does a quoted AI “accuracy” measure actually predict?
- Were results tested on unseen data, and do they include costs and unfavorable periods?
- What compensation, fees and conflicts should the practice understand?
- What monitoring and escalation process applies when circumstances change?
Ask how any proposed approach compares on liquidity, principal risk, costs and operational complexity—not just historical return. Coordinate accounting and tax questions with the practice’s CPA.
Where Practice Finance Support Fits
The finance team’s role is to establish the obligations, available cash and downside funding gaps that frame treasury discussions. That requires reconciled balances, realistic receipt assumptions and visibility by location and entity.
Lucid Financials provides CPA-led bookkeeping, tax and CFO services for staffed US private medical practices, combining AI-assisted financial work with a human finance team. That support can help organize the practice’s financial picture; it should not be confused with candlestick software or investment-management services.
The governing principle is straightforward: evaluate operating reserves against obligations and liquidity dates, not the appeal of a chart pattern. AI may help describe market data. It cannot establish that payroll money will retain its value or arrive when needed.
FAQs
Can AI candlestick analysis show that medical practice reserves are safe?
No. Candlestick analysis summarizes prices and may generate historical pattern comparisons. It does not establish principal protection, future sale proceeds or timely access to cash. Reserve decisions need a dated funding plan and an assessment of downside exposure and access restrictions.
Does a high backtested win rate justify using payroll reserves?
No. Win rate alone does not show loss size, drawdowns, transaction costs or whether cash would have been available on the practice’s payment dates. Even a well-designed historical test cannot establish future outcomes. Evaluate the funding obligation separately from the model’s reported performance.
Is candlestick analysis completely irrelevant to a practice owner?
It can provide limited educational context about price movements and market variability. Its usefulness is narrower than the behavioral stories sometimes attached to it. For treasury decisions, liquidity deadlines, downside funding gaps, concentration and professional investment advice are more directly relevant.
What should a practice prepare before meeting an investment adviser?
Bring reconciled account balances, an entity-level cash schedule, payroll funding dates, capital commitments, collections-delay assumptions and existing account restrictions. Identify cash already committed to operations separately from any potential longer-term surplus. Patient-identifiable information is not needed for this treasury discussion.